Tuesday, May 8, 2012

Final Blog- Minneapolis Climate Change

Inside the Metrodome Roof Collapse

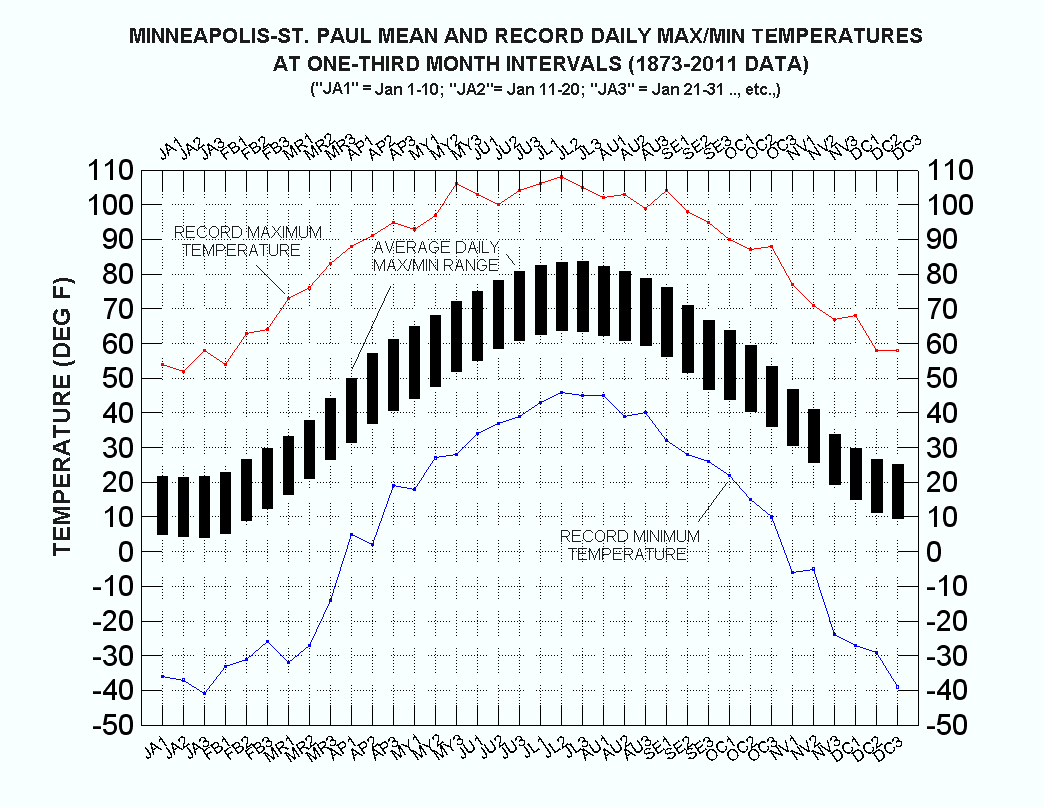
According to the Climate Change 2007: Synthesis Report the probability of cold days becoming less frequent and hot days becoming more frequent is very likely for the last fifty years.  This is definitely true when examining the graphic below which depicts extreme minimum temperatures for Minneapolis, Minnesota over the last fifty years which spans from 1962 to the present year meaning 2012 data is based upon prediction models combined with analysis of past data.  The trend line on the graphic below reflects a climb from the average lowest temperature of the year being about negative twenty seven degrees Fahrenheit in 1962 to about negative twenty degrees Fahrenheit in 2012.  Although there is great variability in the range of lowest yearly temperatures in the past fifty years there seems to be a five to ten year trend where minimum temperatures steadily rise for a few years then steadily decline for the remainder of the period.  The greatest variability of minimum temperatures for Minneapolis  took place in the 1990s in which the highest minimum temperature was negative eleven degrees Fahrenheit which is very close to the minimum temperature reached thus far this year.  Minneapolis’ yearly minimum temperature has not increased enough to be in zone 6 (negative ten degrees Fahrenheit and above on the graphic) the overall trend seems to indicate that Minneapolis’ minimum extreme temperatures are at a steady increase overall.


In relation to the current trend of increasing minimum temperatures analysis also reveals recent trends in the number of hot days in Minneapolis, Minnesota as well.  The graphic below shows the maximum temperatures for the month of March 2012 along with average temperature data as well as record high temperature data for the month of March spanning all the way back to 1939.  The first week of March was relatively normal with temperatures mainly just above or below average temperature trends with no record high temperatures.  The data for the rest of the month indicates eight days of record temperatures and many other temperatures close to record high temperatures.  The data from March 2012 also indicates another trend which is extreme weather differences as high temperatures range from twenty eight degrees Fahrenheit all the way up to eighty degrees Fahrenheit in a thirteen day period.  As with the trend displayed in low temperature data there is a steady rate of increase and decline in high temperatures, but the overall trend seems to be a steady increase.
12 march recs graph.jpg
The Climate Change 2007: Synthesis Report not only predicts that an increase in hot extremes is very likely, but also predicts an increase in precipitation (IPCC, Pg.8).  The graphic below which depicts precipitation data from 1880 to 2000 reveals some trends which correlate with the connection drawn between increased temperatures and precipitation.  The precipitation patterns tend to increase and decrease steadily at five to ten year increments similar to the trends in temperature increase and have extremes in the 1990s that correlate to the trends temperature increase as well.  The overall trend is that average precipitation levels are increasing at a steady rate and there have not been any years of intense precipitation recently.
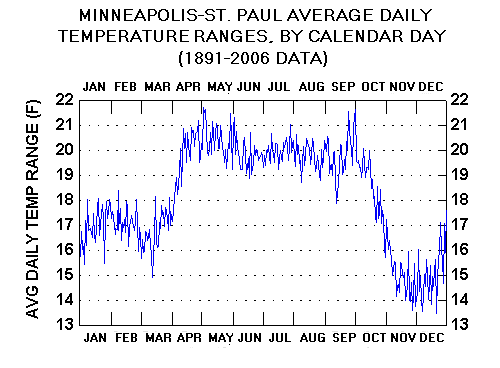
Many of the extreme events in Minneapolis, Minnesota can be attributed to the extreme difference in high and low temperatures such as the trends shown in the second graphic for March.  The graphic shows how a day’s temperature can range can even vary from a low around ten degrees Fahrenheit to a high around sixty degrees Fahrenheit.  Minnesota is currently in a part of five to ten year precipitation stage where levels are currently low.  Therefore the increase in high temperatures has led Minneapolis into a state of severe drought.  Conversely when Minneapolis has a high amount of precipitation extreme temperature variation can cause extreme snow events such as the blizzard which caused the roof of the Metrodome to collapse a few years ago.
Extreme variations in temperature and related events can bring about physical problems such as the aggregate impacts discussed in the Climate Change 2007: Synthesis Report (IPCC, Pg.19). This can have major economic and physical impacts in a commuter oriented city like Minneapolis. Any major damage or disasters would greatly affect the flow of transportation as would any major construction to fix these problems. Events such as the major blizzard which caused millions of dollars of damage to the Metrodome and many communities in Minneapolis not only affected the local community in terms of physical and economic damage. This event shows how a major blizzard can affect tourism and the economic prosperity provided to Minneapolis by an entity such as the National Football League. Seeing these kinds of events certainly does not drive positive interest towards the local tourism market. Minneapolis has proven to be resilient thus far in dealing with issues such as major blizzards and the rapid repair of the Metrodome is a testament to this. As with the issue of aggregate it is harder to say how much impact weather variation will have on Minneapolis transportation infrastructure. Since Minneapolis is heavily commuter oriented there is an immense number of sidewalks, streets, roads, and highways to be focused on which means adaptation and mitigation could be very costly.
roots breaking concrete 

Minneapolis' Climate Action Plan is a community driven program which is aimed at climate change adaptability, mitigation, and sustainability.  This Climate Action Plan serves as a roadmap to decreasing the city's carbon footprint by focusing on climate science, the climate history of Minnesota, and the health impacts of climate change (City of Minneapolis, source 2).  This program involves providing incentives such as grants and other resources in order to promote community awareness and involvement through public meetings and online sources.  Economic incentives such as grants up to $10,000 are provided by American Recovery and Reinvestment Act funds (Minneapolis, source 1).  Minneapolis is one of the first cities in the U.S. with a carbon reduction program and reducing greenhouse gas emissions is directly related to the increase in precipitation and consequent flooding and drought.  The city's goals of emissions:  Reduce citywide greenhouse gas emissions by 15 percent by 2015, and 30 percent by 2025 using 2006 as a baseline (as seen on the graphic below) and reduce municipal operations greenhouse gas emissions by 1.5 percent annually.  Part of this action plan has been teaming up with entities such as Xcel Energy and CenterPoint Energy to create economic incentives for power plants to utilize green technology including energy efficiency rebates, weatherization funds and low-interest financing  as well as incentives for LEED certification (Minneapolis, source 3).   Jeff Opperman a representative of the Nature Conservancy believes that Minneapolis has great adaptive potential in relation to climate change and said," They have a sustainable water supply (the Great Lakes); their heat stress rankings are relatively low; and they are less vulnerable to natural disasters that will be exacerbated by climate change, such as floods, landslides and wildfires," (StarTribune.com).  Measuring sustainability in terms of indicators is one way that Minneapolis has measured its adaptability and effectiveness of preventative measures (Minneapolis, source 4).  Thus far Minneapolis Public Housing Authority (MPHA) received more than $415,000 in rebates from CenterPoint Energy for installing about 100 high-efficiency boilers and 60 domestic hot water heaters in its high-rise buildings as part of a $33.6 million energy conservation project and over ninety LEED certified housing projects have been implemented or completed.  In addition Minneapolis'  Zero-Interest Energy Efficiency Loan Program funded almost $100,000 in improvements to Minneapolis businesses which has resulted in benefits from savings on utility bills, while also reducing their need for greenhouse gas-emitting sources of energy (Minneapolis, source 3).  Overall the city of Minneapolis has made great efforts to promote community involvement and awareness of the issue of climate change by providing many great incentives and resources to citizens.
Sources: 


Tuesday, May 1, 2012

Blog Three: Minneapolis Climate


Minneapolis' latitude and continentality contribute to the large range in seasonal temperatures and solar intensity on a meso-scale. For instance in the summer time it has been recorded that temperatures in the shade can differ as much as 10-20 degrees from areas in direct sunlight (MPR). Proximity to the Great Lakes can have a significant impact on Minneapolis' climate on a meso-scale similar to other areas north of Minneapolis such as Duluth, MN. In the winter months Minneapolis may experience cold arctic air masses, especially during the months of January and February (50STS). On a meso-scale the moderating effect of Lake Superior keeps the surrounding area relatively cooler in the summer and relatively warmer in the winter (Wiki). On a micro-scale Minneapolis experiences urban affects on cloud cover, precipitation intensity and coverage, hail, atmospheric chemical properties, low-level wind flows, and heat and moisture distribution (NWAS). In the winter months low pressure areas from Canada often move into Minneapolis causing alberta clippers or panhandle hooks; some of which develop into sharp cold fronts and drastically lower temperatures and even cause blizzards (AkaQA).

                                    Image Source:  http://uisevereweather.pbworks.com/w/page/12692704/Minneapolis
                                            
Sources:
http://minnesota.publicradio.org/collections/special/columns/updraft/archive/2010/03/target_field_features_many_mic.shtml
http://50southtenthstreet.axisportal.com/Weather.axis
http://en.wikipedia.org/wiki/Climate_of_Minnesota
http://www.nwas.org/digest/papers/1978/Vol03No3/1978v003no03-Lyons.pdf
http://www.akaqa.com/question/q19192030710-What-is-the-medium-humidity-in-minneapolis-mn?page=1


                                 Image Source:  http://www.climatestations.com/images/stories/minneapolis/mspyear.gif


Minneapolis’ average temperatures range between 7 and 24 degrees Fahrenheit in January and between 64 and 84 degrees Fahrenheit in July.   Temperatures tend to stay relatively moderate between April and October while temperatures tend to fall much lower between November and February.

                                                           Image Source:  http://www.climatestations.com/images/stories/minneapolis/msprange.gif

Overall Minneapolis tends to have its coolest average temperatures in January and its warmest average temperatures in July which correlates to climate patterns typical of the northern hemisphere.  One suprising factor is the moderately stable wind speed patterns which seem a little too moderate for the variances in temperature considering how large of a part wind plays in the micro-scale climate controls.
                                        Minneapolis, Minnesota Temperature Chart
                                                                      Image Source: http://www.climatetemp.info/usa/minneapolis-minnesota.html


According to the Koppen Geiger Climate Classification System Minneapolis falls in the hot summer humid continental climate zone (Dfa) (Wiki).  Minneapolis is within the lower third section of Minnesota which is classified as Dfa while the top two thirds of the state is Dfb which has milder summer conditions.


                                                                                 Image Source: http://en.wikipedia.org/wiki/Pierre,_South_Dakota
                                                  
                                     Image Source: http://www.usclimatedata.com/climate.php?location=USMN0503


Tuesday, April 17, 2012


Blog Reflection #1
Duluth Map
I have chosen to compare my analysis of Minneapolis, MN to Scott Kerr’s analysis of Duluth, MN.  While comparing Scott Kerrs’s blog to my own I found many similarities and differences in the climate, air mass variation, and local weather event information presented as well as the way in which this information was presented.  I like how Scott relates his climate analysis directly to the precipitation data presented as well as built upon his analysis gradually to exemplify the reasoning behind his Bowen Ratio guestimate.
Since our sites are very close to each other I was not surprised to find many similarities in our conclusions about temperature and precipitation variations.  Although our analysis of climate was quite different we both had a strong focus on the surrounding bodies of water and vast amount of lakes in Minnesota which is likely why we had such similar conclusions about temperature variance, precipitation variance, continentality, and the Bowen Ratio.Duluth, Minnesota Climate Graph

 
Although the Average Monthly Precipitation is very similar for Minneapolis and Duluth I noticed some slight variation in the summer months in particular.  Throughout June, July, and August Minneapolis hits its peak for the average amount of precipitation which is around four inches. The effect of Duluth’s proximity to Lake Superior on the maritime influence on the climate is apparent by the vast difference in average precipitation for the month of September compared to Minneapolis.  Minneapolis receives two and a half inches of precipitation in September on average while Duluth receives just over four inches. 
Average Rainfall for Duluth, Minnesota
Average Rainfall for Minneapolis-St.Paul, Minnesota

Scott’s analysis of air masses was much more detailed than mine in terms of the seasonality of air masses which affect Duluth.  An example of this is the detail on how cT air masses can push upward during the summer causing heat waves as well as how late season mT can bring about early snow. 
hpc_36_fcst.gif
Scott and I both come to similar conclusions about cold occlusions in the region, but Scott takes his analysis even further and applies analysis on the current conditions.  Scott includes a graphic showing air masses during a major storm from 2010 which really supplements his analysis of the current conditions which were stable at the time.Source: http://minnesota.publicradio.org/collections/special/columns/updraft/archive/2010/12/
snow_abates_late_but_storm_two.shtml
Scott decided to focus on three local phenomena which are similar to lake effect snow, but are definitely more unique to Duluth than Minneapolis. It is quite apparent that Duluth’s proximity to Lake Superior has a profound effect on local weather patterns and is the one of the main reasons why Duluth is effected by different weather phenomena than Minneapolis especially more intense effects on precipitation.  Cold air that has drifted over Lake Superior has been known to cause ice storms as well as keep temperatures moderate in the summer.  Duluth and Minneapolis exemplify how a large amount of lakes or a large sized lake in close proximity to a location can have dramatic effects on local weather patterns as well as cause localized weather phenomena.
As seen by the graphic showing average annual precipitation Duluth and Minneapolis both fall within areas that receive quite a high amount of precipitation on a statewide level.


Thursday, April 5, 2012

GEOG 3232 Blog #2


                                                          Source: http://www.minneapolis.world-guides.com/minneapolis_maps.html
1.  Minneapolis, Minnesota is affected by cP and cA air masses in the winter months and affected by mT air masses in the summer (Forest Encyclopedia). 

Source for question one:  http://forestencyclopedia.net/p/p399
airmasses.jpg

2.  Minneapolis experiences cold fronts and warm fronts which result in cold occlusions.
hpc_36_fcst.gif
                                      Source: http://cde.nwc.edu/SCI2108/course_documents/earth_moon/earth/weather/airmasses.htm
US: Current Weather

                         Source: http://www.weather.com/maps/maptype/currentweatherusnational/uscurrentweather_large.html
          
                                            Source: http://www.weather.com/weather/map/USMN0503?mapdest=US_Current_Weather:NC
4.  Minneapolis along with most of the rest of the state is not located on the lee side of the Great Lakes which means Minneapolis does not commonly receive lake affect snow from lake superior or any of the Great Lakes  (MPR).  However Minnesota is the "Land of over 10,000 Lakes" and Minneapolis contains quite a large amount of lakes including a Chain of Lakes which consists of the six major lakes in the city.  These are by far not the only lakes in Minneapolis the Great Chain of Lakes are surrounded by dozens if not hundreds of small lakes which perpetuate the lake snow effect in the months the lakes aren’t frozen.

Illustration of the Minneapolis Chain of Lakes
                                                                       http://www.epa.gov/owow/NPS/success/state/mn_chain.htm
1 1 1 1 1 1 1 lake effct.png
This image shows lake effect plumes over Lake Superior as well as snow covered lakes in mid and lower Minnesota in February.  There are heavy concentrations of snow above lakes and a heavy concentration of snow on the surface in southern Minnesota.
                                                                           Source:  http://minnesota.publicradio.org/collections/special/columns/updraft/archive/lake-effect-snow/
This lake effect snow machine dissipates in the coldest months of the year when cA air masses in the months of January and February until incoming solar radiation increases in the weeks following the coldest weeks in mid-February.
Snowfall totals, including lake effect
                                                                                   Source: http://www.wunderground.com/blog/sullivanweather/archive.html?year=2007&month=11
http://minnesota.publicradio.org/collections/special/columns/updraft/archive/daylight/


Thursday, March 8, 2012

GEOG Blog #1

Weather and Climate of Minneapolis, Minnesota

1)

                                 *Source: http://www.climatetemp.info/usa/minneapolis-minnesota.html

The first model's precipitation data closely resembles the precipitation data shown in the Average Monthly Precipitation where the highest average falls in the month of June and an overall higher pattern in the summer.


                             *Source: http://www.rssweather.com/climate/Minnesota/Minneapolis-St.Paul/


                          *Source: http://www.prism.oregonstate.edu/state_products/index.phtml?id=MN


Although Minneapolis, Minnesota is located quite close to Lake Superior and is surrounded by over eleven thousand lakes the monthly average weather data does not seem to indicate any signigicant level of maritimity. Variance in humidity levels in relation to average temperatures also seem to exemplify the low level of maritimity of Minneapolis.                                          
                                      *Source: http://www.davedoran.com/
2)
Minneapolis is located beneath the Rainy and Superior Geographic Lobes which consist of basalts, gabbro, granite, iron formation, red sandstone, slate, and greenstone strewn due to glacial advances.  As a result there are many glacial deposits, lakes, and rivers in the area around Minneapolis (1). Vegetation is quite diverse and includes emergents found in shallow waters such as  Blueflag Iris, bulrushes and broad-leaved arrowhead as well as wet meadows that include plants such as Swamp milkweed, Joe-pye weed and blue vervain.  Vegetation ranges broadly as wet, mesic and dry prairies and also includes wetlands, woodlands, and rolling plains as well (2).

                        *Sources: (1) http://www.dnr.state.mn.us/snas/naturalhistory.html
                                         (2) http://www.minneapolisparks.org/default.asp?PageID=708


Do to the fact that Minneapolis, Minnesota is surrounded by a very large quanity of various sized bodies of water my guestimation for the Bowen Ratio is low.  Even though the humidity levels and average temperatures are moderate for the most part I still believe that the Bowen Ratio is lower than the U.S. average.
                               *Source: http://passingthru.com/2009/08/lake-minnetonka-the-lure-and-the-lore/

3)
I believe the Bowen Ratio is about .55 or so do to the circumstances surrounding the geography and climate of the area.

4) Using GEEBIT B3:
A) When I decreased the albedo by .10 I noticed that the energy absorbed at the planet's surface
average and maximum increase as well as the resulting surface temperature.  Conversely these same levels decrease when I increase the albedo to .406.
B) When I decreased the greenhous factor by 10% the average and max energy absorbed at planet's surface decrease as well as the resulting temperature. Conversely when I increase the greenhouse factor by 10% these same levels increase by a small amount.
C) These changes could affect the environment and climate by either warming the location beyond or below normal conditions.  Climate changes such as strengthening of the glacial structures could increase the sub-polar aspect of the climate if absorbtivity decreases at the surface.  Increased absorbtivity at the surface could cause the opposite reaction causing melting which would strengthen the network of lakes and possibly affect the maritimity of the area.

*word count without captions 250